Cost
Drivers Affecting Deployment of COTS-Based Systems
Jeffrey S. Poulin and Walt A. Johnson
Lockheed Martin Systems Integration
Owego,
New York
Abstract
Modern projects often involve the integration and deployment of many COTS packages to meet customer requirements. When estimating the effort for these projects, the team must make sizing and pricing assumptions based on past performance, their experience, and on information obtained from the customer. A cost engineering or pricing team uses these assumptions as input to their pricing model, which forms part of the final proposal. During the subsequent performance period, the team often discovers new information that significantly alters the original size and cost assumptions. This paper analyzes the results from two large projects to include their objective, baseline and actual requirements, baseline and actual cost drivers, affect on overall cost, and lessons learned.
1.0 Program A
The
first project that we will examine had the mission of migrating data from
various data-intensive applications into a data warehouse for common data
mining and decision support analysis.
The environment consisted primarily of IBM System 390 mainframes running
MVS and the DB2 database system. In
addition, the project employed the Datalogic GUI builder, the PRISM code
generator for COBOL applications, and various APIs as required for interfacing
to a number of legacy systems.
1.1 Cost Drivers
During
the proposal phase, the cost engineering team collected potential cost drivers
for the project for input their sizing model.
During this time, the team calculated the approximate size of the
affected systems at 4375 function points, or 350k SLOC of COBOL and 50k SLOC of
programs written primarily in Java, C, and REXX. Figure 1 shows a partial list of the items used in preparing
the cost model, to include the presence of an existing data warehouse, the
assumed number of tables to create in the warehouse schema, the number of data
sources, and the number of users and their relative skill levels.
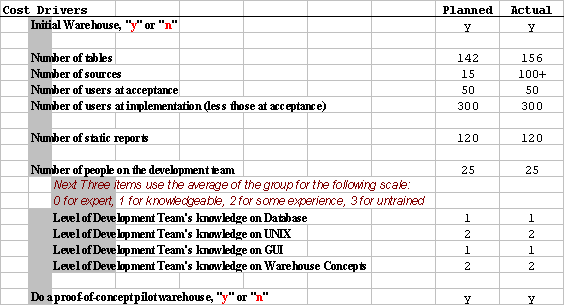
Figure 1- Cost Drivers for Program A
In
each case, the table compares the data used to estimate the cost of the project
versus the actual results at the end of the project. The data shows extremely consistent values in almost all areas,
which indicates thorough fact-finding and solid assumptions at the time of the
proposal. The notable exception comes
from the number of data sources planned at the time of the proposal versus that
actually found during the performance period.
1.2 Requirements Volatility
Not
surprisingly, this discrepancy in the number of data sources caused
requirements volatility early in the program.
Whereas the customer believed they had only 15 data sources, these
systems actually touched over 100 other subordinate systems to extract,
transform, and modify data.
Furthermore, the 100+ systems employed disparate schemas, formats, and
business rules, causing the performance team to make multiple design iterations
and modifications to the data warehouse schema.
Interestingly,
with this exception the approximately 700 customer requirements for the project
remained surprisingly stable. The
performance team established formal change request (CR) procedures with the
customer and processed only 61 CRs for their Release 1 (8%) and almost half
that (34 CRs) for Release 2, affecting only 5% of the total requirements. The team noted that these did not cause a
major impact and they were able to efficiently handle the requests with the
customer.
1.3 Cost Impact
The
discovery of the large number of unexpected data sources caused a large cost
impact early in the project, driving Release 1 to 5.1x projected cost. Once contained, they only affected Release 2
by a factor of 2.2, for an overall cost impact to the project of 2.6x. Clearly in this case the limited information
actually known by the customer and related to the proposal team had the driving
impact on the project. In fact, most of
this documentation did not even exist.
In this case the diverse nature of interfaces and the large number of
unique business rules that they implemented required expensive custom handling
and development.
2.0 Program B
The second project that we
will examine had the mission of developing and integrating products for processing
addresses on mail pieces using optical character recognition. The environment consisted of large numbers
of IBM RISC/6000 application and data servers running the AIX operating system
and Oracle database system, as well as large numbers of standard Intel-based
processors running the Microsoft NT operating system.
2.1 Cost Drivers
The major areas of cost followed a routine breakdown into system design and development, network, interface development, project management, as well as support activities for training and post-deployment maintenance and enhancements. System design and development constituted the vast majority of this breakdown, as it included all software development, procurement of COTS software licenses and hardware, and final integration and test of all these end-items. As a COTS-based proposal, the cost model depended heavily on the large percentage (53%) of COTS and unmodified reuse components.
2.2 Requirements Volatility
Soon
after contract award, indications began to emerge that the customer had started
to favor unique and custom capabilities beyond those provided by the COTS
products and existing components described in the proposal. Figure 2, which depicts the total number of
requirements over time, shows the clearest indication of this trend. While early in the project the performance
team believed that it could meet contract requirements with the proposed COTS
solution, the customer began to clarify and enhance the baseline function in
the form of new requirements. These new
requirements grew rapidly from June 1998 through October 1999, when the
customer’s executive management became aware of the cost of the changes
requested by their users. The customer
executive management reacted by directing a “design to cost” approach with
increased receptivity to the original COTS solution. After experiencing a 42% fluctuation, the total number of
requirements subsequently dropped.
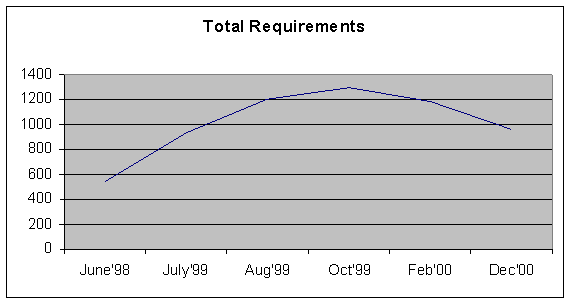
Figure 2- Requirements Volatility for Program B
Once
requirements began to stabilize, the CR process quickly helped stabilized the
impact to the project. As shown in
Figure 3, the performance team managed requirements with the customer using an
effective CR process. Requirements
volatility became an inconsequential 5.1%.
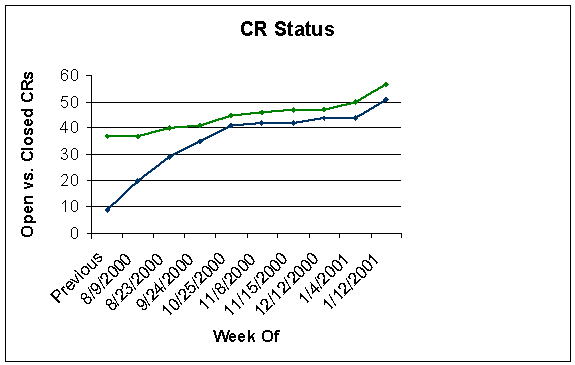
Figure 3- Change Requests for Program B
2.3 Cost Impact
Because the project cost model depended heavily on the use of COTS integration and use of existing software, deviation from this approach by the customer had a large impact on costs. Normalized, these only amounted to a 5% increase over Release 1 estimates and an 11% increase over Release 2 estimates. However, Figure 4 does a much better job of portraying how not adhering to the COTS approach impacted the program and the sizing model
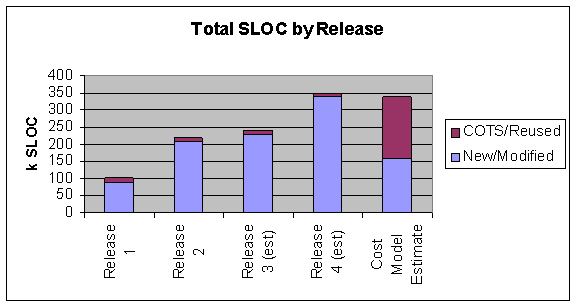
Figure 4- SLOC History of Program B
The figure actually shows two important things. First, the inputs to the sizing model resulted in an extremely accurate estimate of the projected size of the completed system as compared to the current estimate at completion (EAC) of the final system. This serves as a useful validation of the parametric inputs and of the model itself. Second, the model paints a very cogent picture of the deviation from a COTS and reused-based vision to one of custom development.
3.0 Conclusion
This paper compared the cost models versus actual experiences from two COTS-based programs. Obviously cost model need good data and reliable assumptions. In each case, detailed information provided to personnel responsible for estimating total program costs changed during the period of contract performance. This caused the affected program to deviate from planned cost, which it had to manage with its customer. In the first case, the discovery of new information drove enhancements to the proposed solution. In the second case, the transition from the proposed COTS approach to a custom development significantly altered the final solution. Both programs showed excellent control over change requests throughout the performance period. Likewise, the cost models used by these programs succeeded in identifying and quantifying the development that actually took place.